.NET Core coverage with coverlet
At work we work mainly with Microsoft technologies, so I’m being exposed to things like C#, .NET Core, .NET Framework, Azure, etc. So I’m vesting more time learning tools and processes around Microsoft tools. This post is a kind of recipe to get started into .NET Core 3.1 with coverage and SonarQube to keep track of metrics.
Pre-requisites
First of all I consider that…
- You have .NET Core 3.1 installed
- Docker way: you will need Docker installed, Docker Desktop or Docker Machine if you do not have Windows Pro
- Java way: we will install Java 11+ (so do not worry) to run SonarQube on top of Windows
Create the project
Let’s start by creating two projects: the program itself and the test one. Then we create a solution file (sln), add both projects and reference the program from the test project:
mkdir dotnet-coverage
cd dotnet-coverage
dotnet new console -o Cover
dotnet new xunit -o Cover.Tests
dotnet new sln
dotnet sln dotnet-coverage.sln add Cover/Cover.csproj
dotnet sln dotnet-coverage.sln add Cover.Tests/Cover.Tests.csproj
dotnet add Cover.Tests/ reference Cover/
PD: yeah, write it.
By default, the xunit .NET Core project template comes with coverlet which is the framework that will retrieve the code coverage. So we do not need to modify the Cover.Tests/Cover.Tests.csproj to get the coverage, it comes out of the box. Yay!
Create a function and a test
Now that we have our two projects, we can add a simple function in our Cover project and a test using that funcion in our Cover.Tests project:
// Cover/Program.cs
using System;

namespace Cover
{
    public class Program  // <--- Important! Add the public keyword here
    {
        static void Main(string[] args)
        {
            Console.WriteLine("Hello World!");
        }

        public static int Sum(int a, int b)  // <--- Important! Add the public keyword here
        {
            return a + b;
        }
    }
}
And now let’s use the Program.Sum function in our test:
// Cover.Tests/UnitTest1.cs
using System;
using Xunit;

using Cover;

namespace Cover.Tests
{
    public class UnitTest1
    {
        [Fact]
        public void Test1()
        {
            var result = Program.Sum(1, 3);  // This comes from 'using Cover'
            Assert.Equal(4, result);  // This comes from 'using Xunit'
        }
    }
}
Great! Done!
Collect the coverage
With our function and test created, we can start to get that coverage. We should pass the flag --collect="XPlat Code Coverage" to the dotnet test:
PS> dotnet test --collect="XPlat Code Coverage"
Serie de pruebas para C:\Users\hector\Projects\dotnet-coverage\Cover.Tests\bin\Debug\netcoreapp3.1\Cover.Tests.dll(.NETCoreApp,Version=v3.1)
Microsoft (R) Test Execution Command Line Tool Version 16.3.0
Copyright (c) Microsoft Corporation.  All rights reserved.

Starting test execution, please wait...

A total of 1 test files matched the specified pattern.


Attachments:
  C:\Users\hector\Projects\dotnet-coverage\Cover.Tests\TestResults\2566a633-f52b-4bee-9664-905efc0060a7\coverage.cobertura.xml
Test Run Successful.
Total tests: 1
     Passed: 1
 Total time: 1,0980 Seconds
This will create a Cobertura XML file which looks like this one:
<?xml version="1.0" encoding="utf-8"?>
<coverage line-rate="0.5" branch-rate="1" version="1.9" timestamp="1586776435" lines-covered="3" lines-valid="6" branches-covered="0" branches-valid="0">
  <sources>
    <source></source>
  </sources>
  <packages>
    <package name="Cover" line-rate="0.5" branch-rate="1" complexity="2">
      <classes>
        <class name="Cover.Program" filename="C:\Users\hector\Projects\dotnet-coverage\Cover\Program.cs" line-rate="0.5" branch-rate="1" complexity="2">
          <methods>
            <method name="Main" signature="(System.String[])" line-rate="0" branch-rate="1">
              <lines>
                <line number="8" hits="0" branch="False" />
                <line number="9" hits="0" branch="False" />
                <line number="10" hits="0" branch="False" />
              </lines>
            </method>
            <method name="Sum" signature="(System.Int32,System.Int32)" line-rate="1" branch-rate="1">
              <lines>
                <line number="13" hits="1" branch="False" />
                <line number="14" hits="1" branch="False" />
                <line number="15" hits="1" branch="False" />
              </lines>
            </method>
          </methods>
          <lines>
            <line number="8" hits="0" branch="False" />
            <line number="9" hits="0" branch="False" />
            <line number="10" hits="0" branch="False" />
            <line number="13" hits="1" branch="False" />
            <line number="14" hits="1" branch="False" />
            <line number="15" hits="1" branch="False" />
          </lines>
        </class>
      </classes>
    </package>
  </packages>
</coverage>
This format is the default of coverlet, but can be changed via settings. We will change it later.
Generating reports
Now that we got our coverage reported, it is useful to create a report from that XML, since it is not created to be read by humans. Here we use ReportGenerator:
PS> dotnet tool install dotnet-reportgenerator-globaltool --tool-path tools
PS> ./tools/reportgenerator.exe -reports:Cover.Tests/TestResults/2566a633-f52b-4bee-9664-905efc0060a7/coverage.cobertura.xml -targetdir:report/
2020-04-13T12:53:38: Arguments
2020-04-13T12:53:38:  -reports:.\Cover.Tests\TestResults\2566a633-f52b-4bee-9664-905efc0060a7\coverage.cobertura.xml
2020-04-13T12:53:38:  -targetdir:report\
2020-04-13T12:53:39: Executable: C:\Users\hector\Projects\dotnet-coverage\tools\.store\dotnet-reportgenerator-globaltool\4.5.5\dotnet-reportgenerator-globaltool\4.5.5\tools\netcoreapp3.0\any\ReportGenerator.Core.dll
2020-04-13T12:53:39: Working directory: C:\Users\hector\Projects\dotnet-coverage
2020-04-13T12:53:39: Writing report file 'report\index.htm'
2020-04-13T12:53:39: Report generation took 0,5 seconds
This will create a very useful HTML, where we can inspect our coverage line by line, per namespaces, DLLs, etc.:
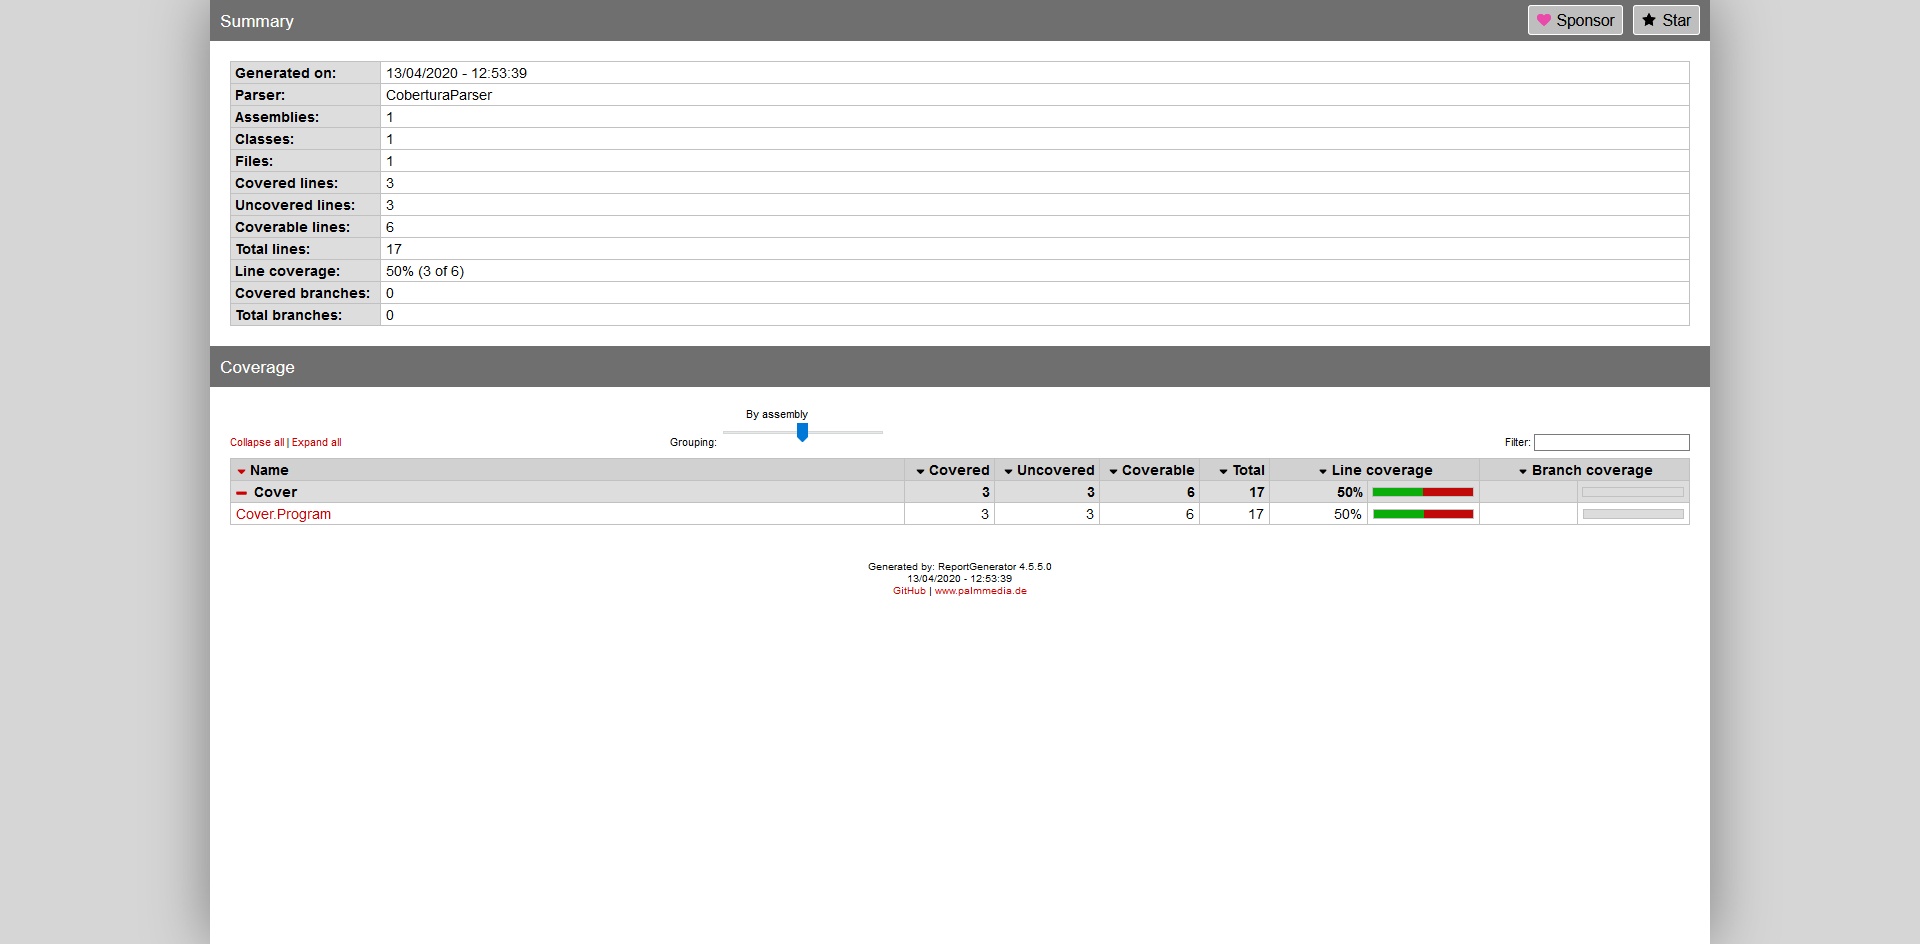
Default view of the report.
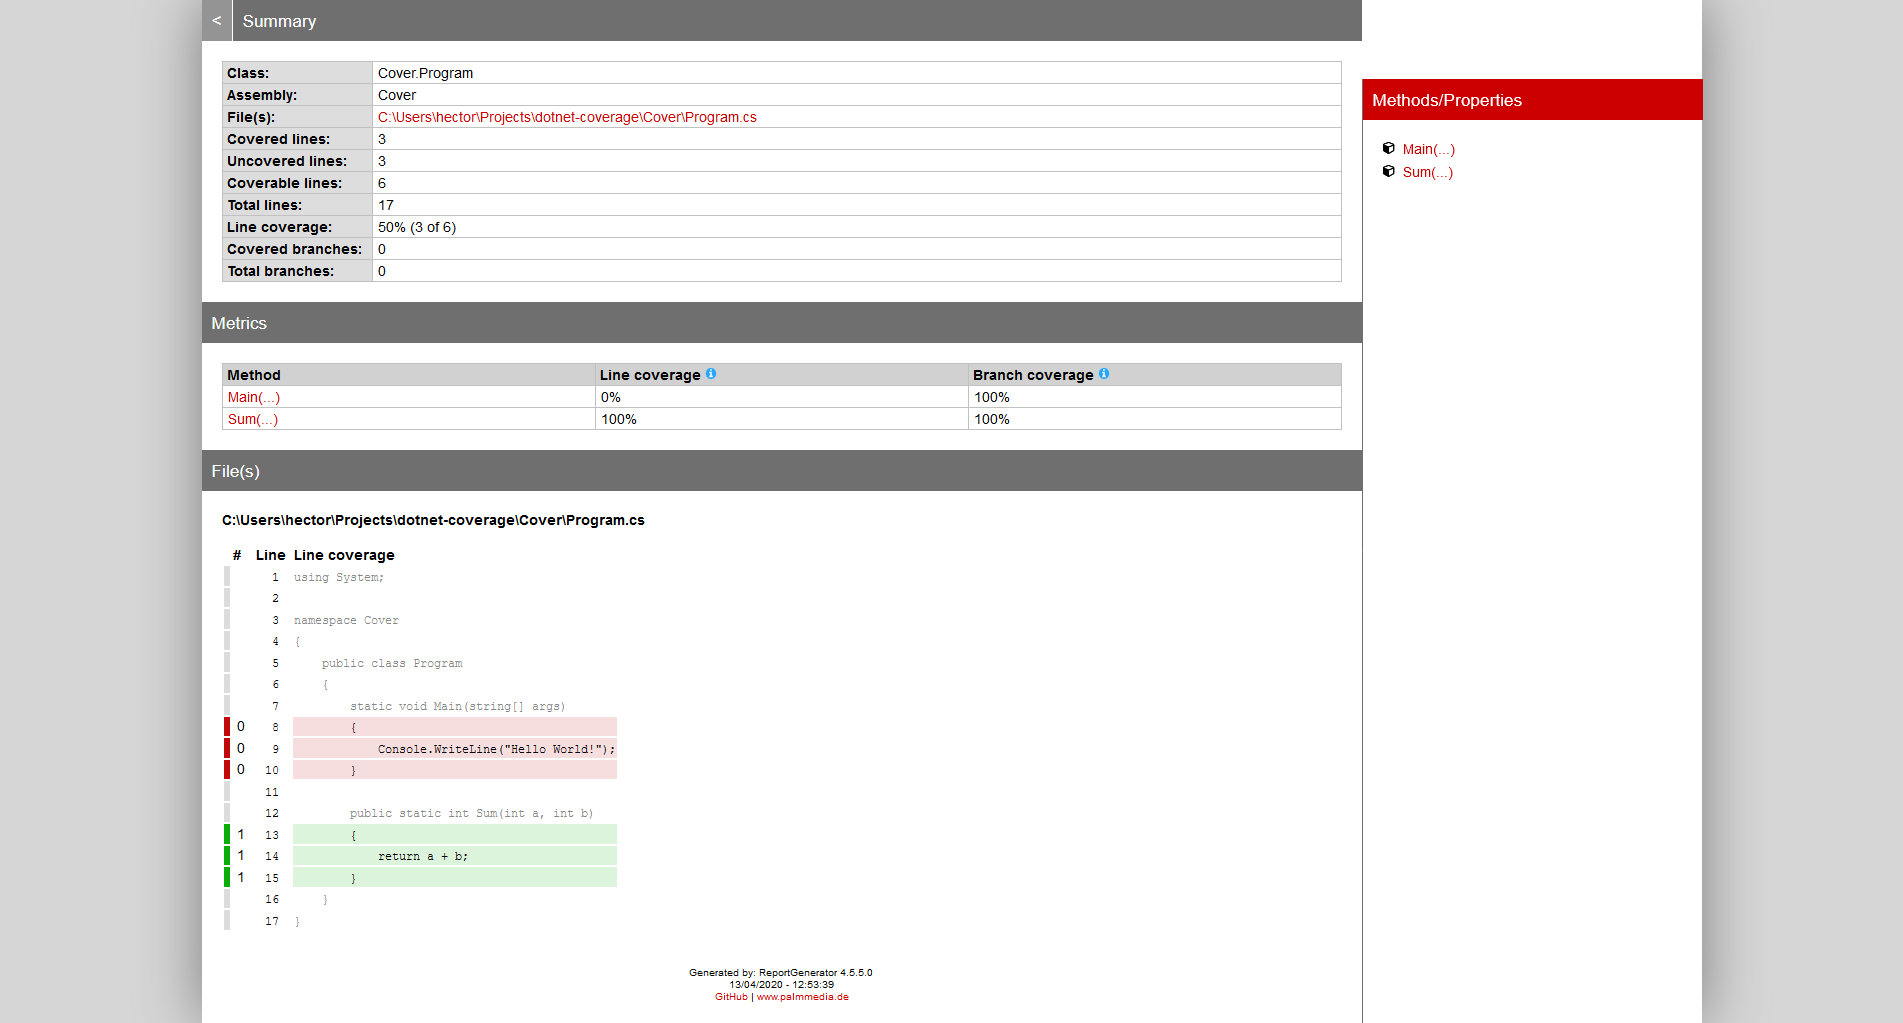
Detail of a file.
Runsettings file
We can customize the testing behaviour via command line, but for the sake of keeping commands short we can use the runsettings file. Here we can specify multiple things, so we can specify the data collection too. Create the coverlet.runsettings file and write the following content:
# coverlet.runsettings
<?xml version="1.0" encoding="utf-8" ?>
<RunSettings>
  <DataCollectionRunSettings>
    <DataCollectors>
      <DataCollector friendlyName="XPlat Code Coverage">
        <Configuration>
          <Format>opencover</Format>
        </Configuration>
      </DataCollector>
    </DataCollectors>
  </DataCollectionRunSettings>
</RunSettings>
Here also we changed the format of the output given by XPlat Code Coverage which is our coverlet collector. To use that file, use the --settings flag with the test command:
dotnet test --settings coverlet.runsettings
SonarQube Server
Since it is widely used and we use it at work, I wanted to be also capable of uploading test results and code coverage to SonarQube. Here we have two ways: with and without Docker.
Java way: I do not have Docker installed!
If you do not have Docker installed, do not worry as we will use the SonarQube Community Windows server. Download it from the SonarQube downloads page and unzip it. Unless you develop with Java you will need a newer version of Java for Windows. Download it from JDK Download page and unzip it too.
Before executing SonarQube we will tell it which executable of Java it should use. Edit the wrapper.java.command=java option inside <install_dir>/conf/wrapper.conf (where install dir is where you unzipped SonarQube) to point to the JDK you just unzipped. In my case it will be wrapper.java.command=C:\Users\hector\Downloads\jdk-14\bin\java.exe. Then run the server:
./bin/windows-x86-64/StartSonar.bat
And a lot of output will appear. Probably a window will pop up to ask your permission to add a firewall rule for the JDK. After a little you could go to http://localhost:9000/ and see you shinny new SonarQube instance.
Docker way: I have Docker!
If you have Docker installed, you only need to run a single command and then visit you browser at http://localhost:9000/. The command is:
docker run -d --name sonarqube -p 9000:9000 sonarqube:8-community
After a little you could go to http://localhost:9000/ and see you shinny new SonarQube instance.
I just started my server!
So your server should look like this:
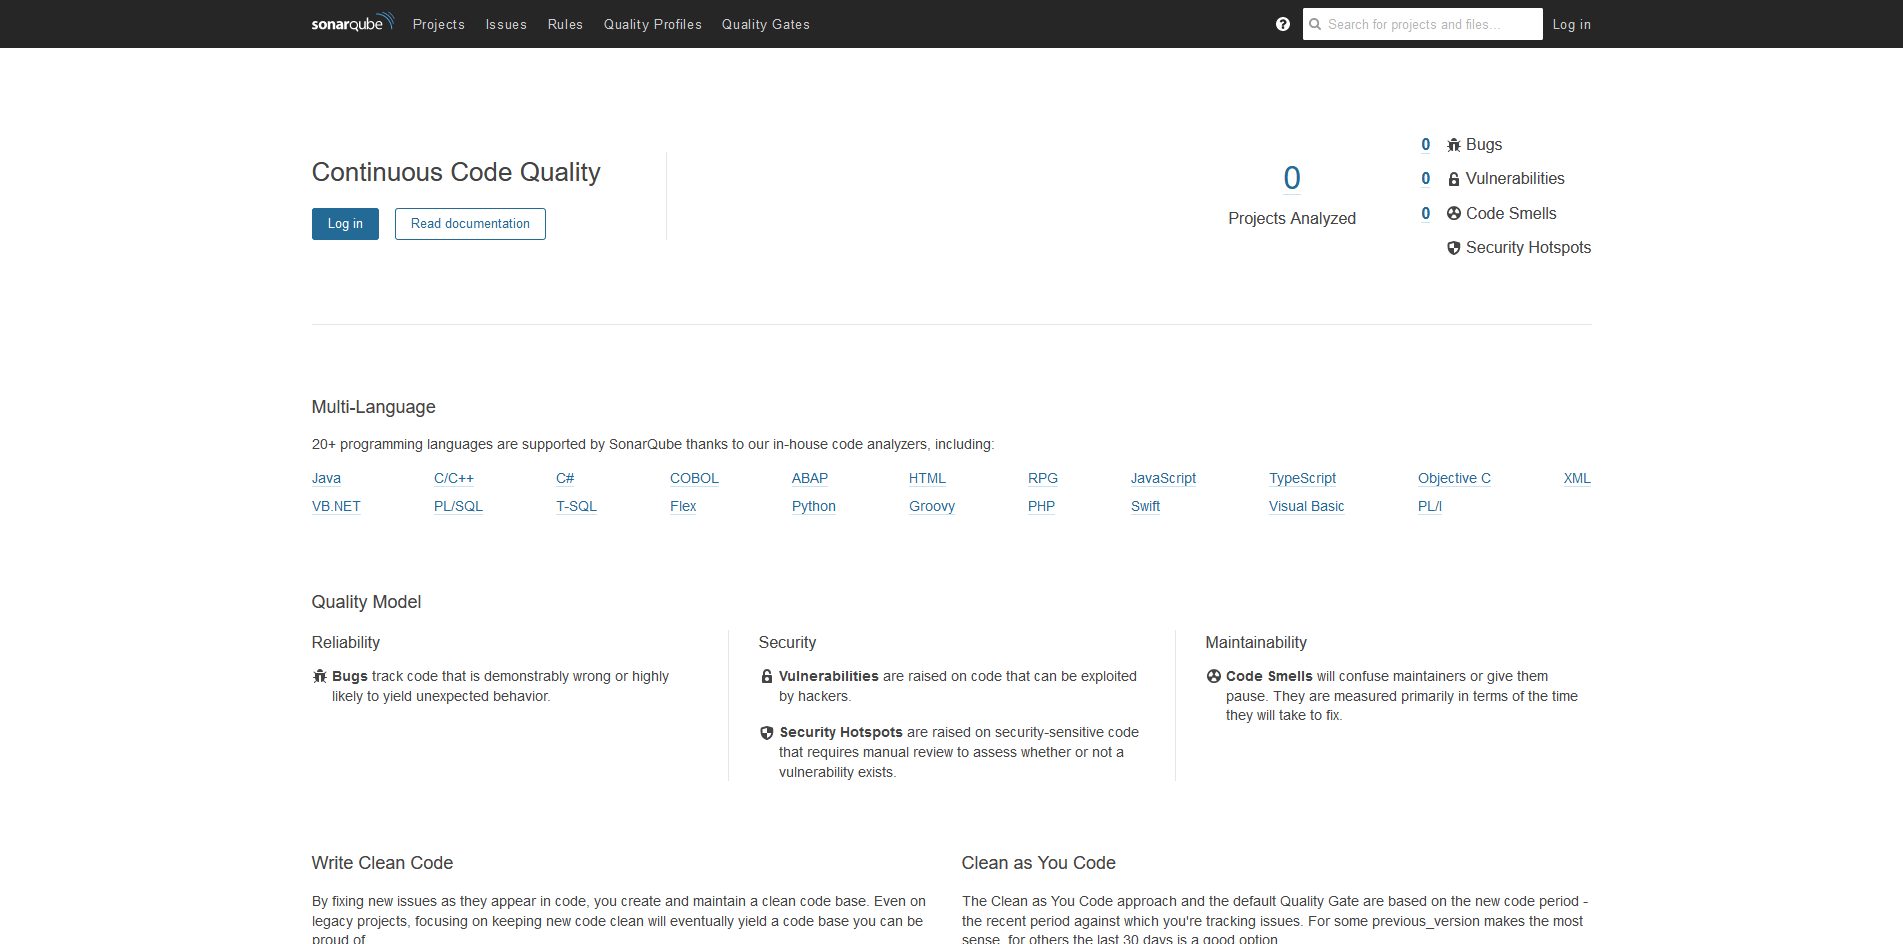
SonarQube default page of a new server.
The default credentials are admin as user and admin as password and we will be using those.
.NET SonarScanner
Now that you have your server up and running, we will download the tool to upload results. Install it the same way that we installed Report Generator before:
dotnet tool install dotnet-sonarscanner --tool-path tools
This will download it locally in a folder called tools so we can execute it directly.
./tools/dotnet-sonarscanner.exe begin -d:sonar.login=admin -d:sonar.password=admin -d:sonar.host.url="http://localhost:9000" -k:"dotnet-coverage"
dotnet test --settings coverlet.runsettings
./tools/dotnet-sonarscanner.exe end -d:sonar.login=admin -d:sonar.password=admin
This won’t be enough, as it will upload code smells, but we miss the code coverage and the number of unit tests.
SonarQube project page with information about our code.
Let’s fix it! If we check the SonarQube guide here and search for C# we will see that multiple options are supported. For example sonar.cs.opencover.reportsPaths which we will specify so SonarQube can find where the coverage is:
./tools/dotnet-sonarscanner.exe begin -d:sonar.login=admin -d:sonar.password=admin -d:sonar.host.url="http://localhost:9000" -k:"dotnet-coverage" -d:sonar.cs.opencover.reportsPaths="Cover.Tests\TestResults\*\coverage.opencover.xml" -d:sonar.cs.vstest.reportsPaths="Cover.Tests\TestResults\*.trx"
dotnet test --settings coverlet.runsettings --logger trx
./tools/dotnet-sonarscanner.exe end -d:sonar.login=admin -d:sonar.password=admin
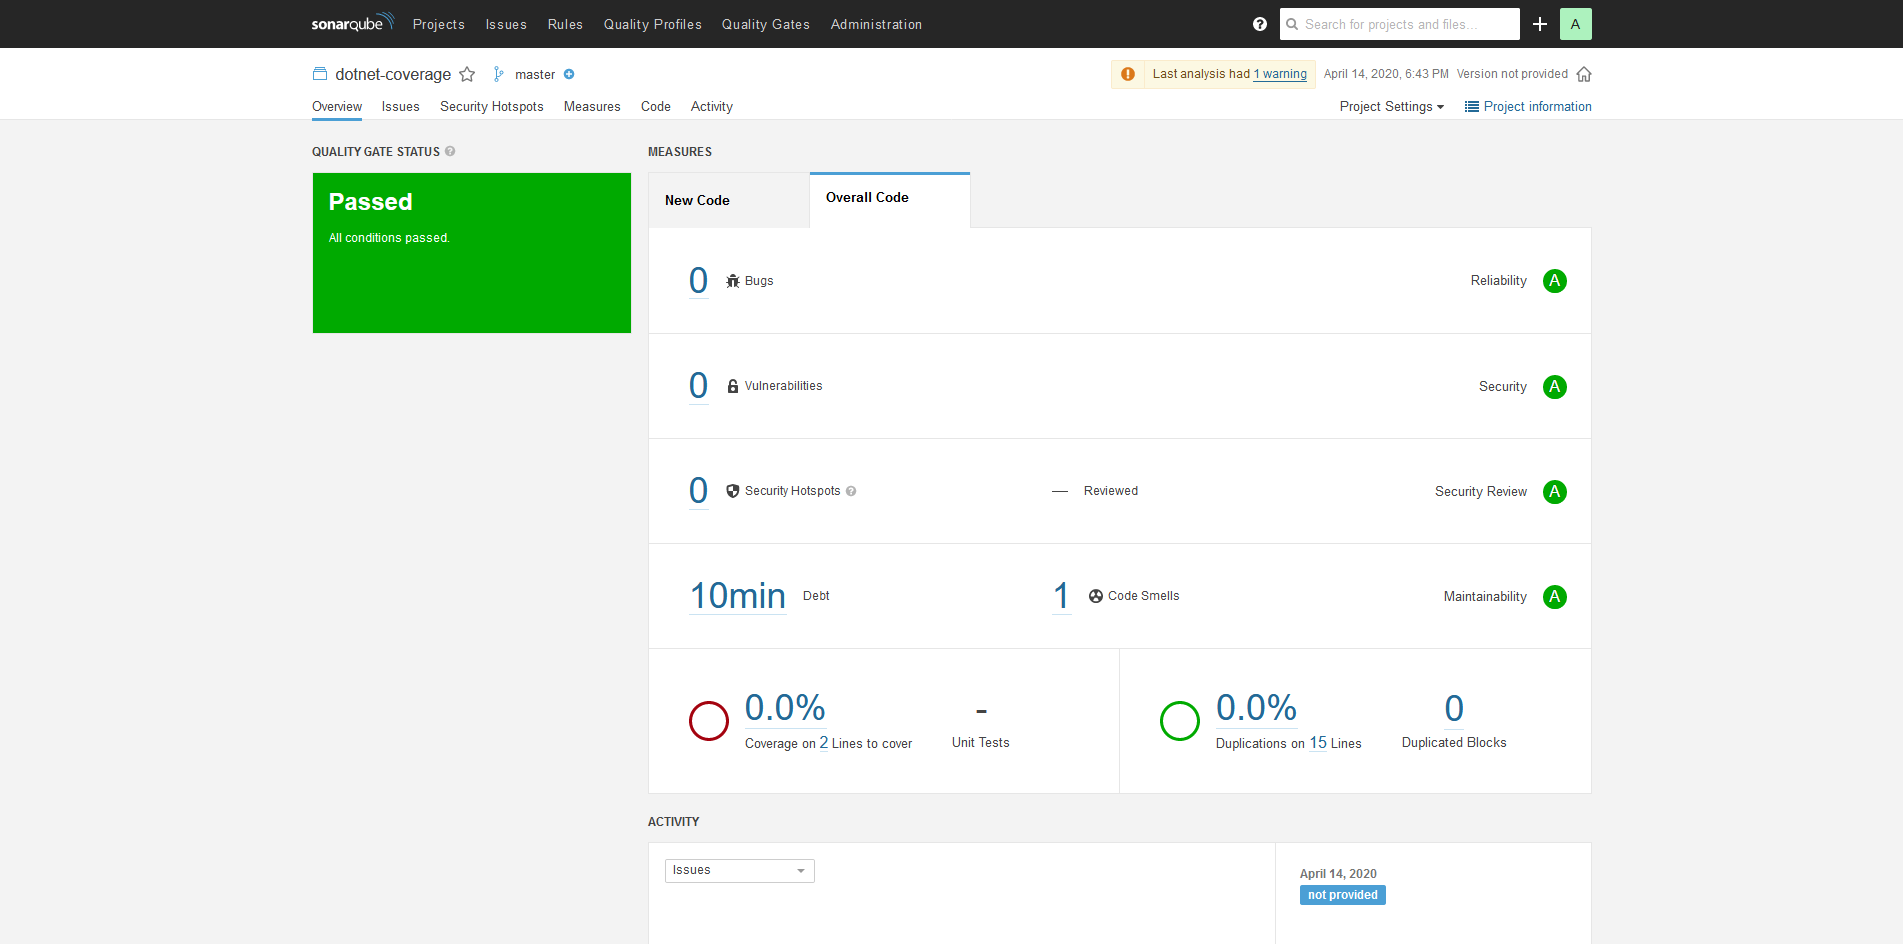
Now it should report a coverage of 50% in the “Overall Code” tab:

SonarQube project page reporting information about the code coverage.
But it is not enough! We want also the number of unit tests.
./tools/dotnet-sonarscanner.exe begin -d:sonar.login=admin -d:sonar.password=admin -d:sonar.host.url="http://localhost:9000" -k:"dotnet-coverage" -d:sonar.cs.opencover.reportsPaths="Cover.Tests\TestResults\*\coverage.opencover.xml" -d:sonar.cs.vstest.reportsPaths="Cover.Tests\TestResults\*.trx"
dotnet test --settings coverlet.runsettings --logger trx
./tools/dotnet-sonarscanner.exe end -d:sonar.login=admin -d:sonar.password=admin
Note how we added another option: -d:sonar.cs.vstest.reportsPaths="Cover.Tests\TestResults\*.trx", this will tell the scanner that should search VSTest files with that pattern. Also note how we added an option to the dotnet test command: --logger trx this outputs the tests results as a TRX which SonarQube can consume.
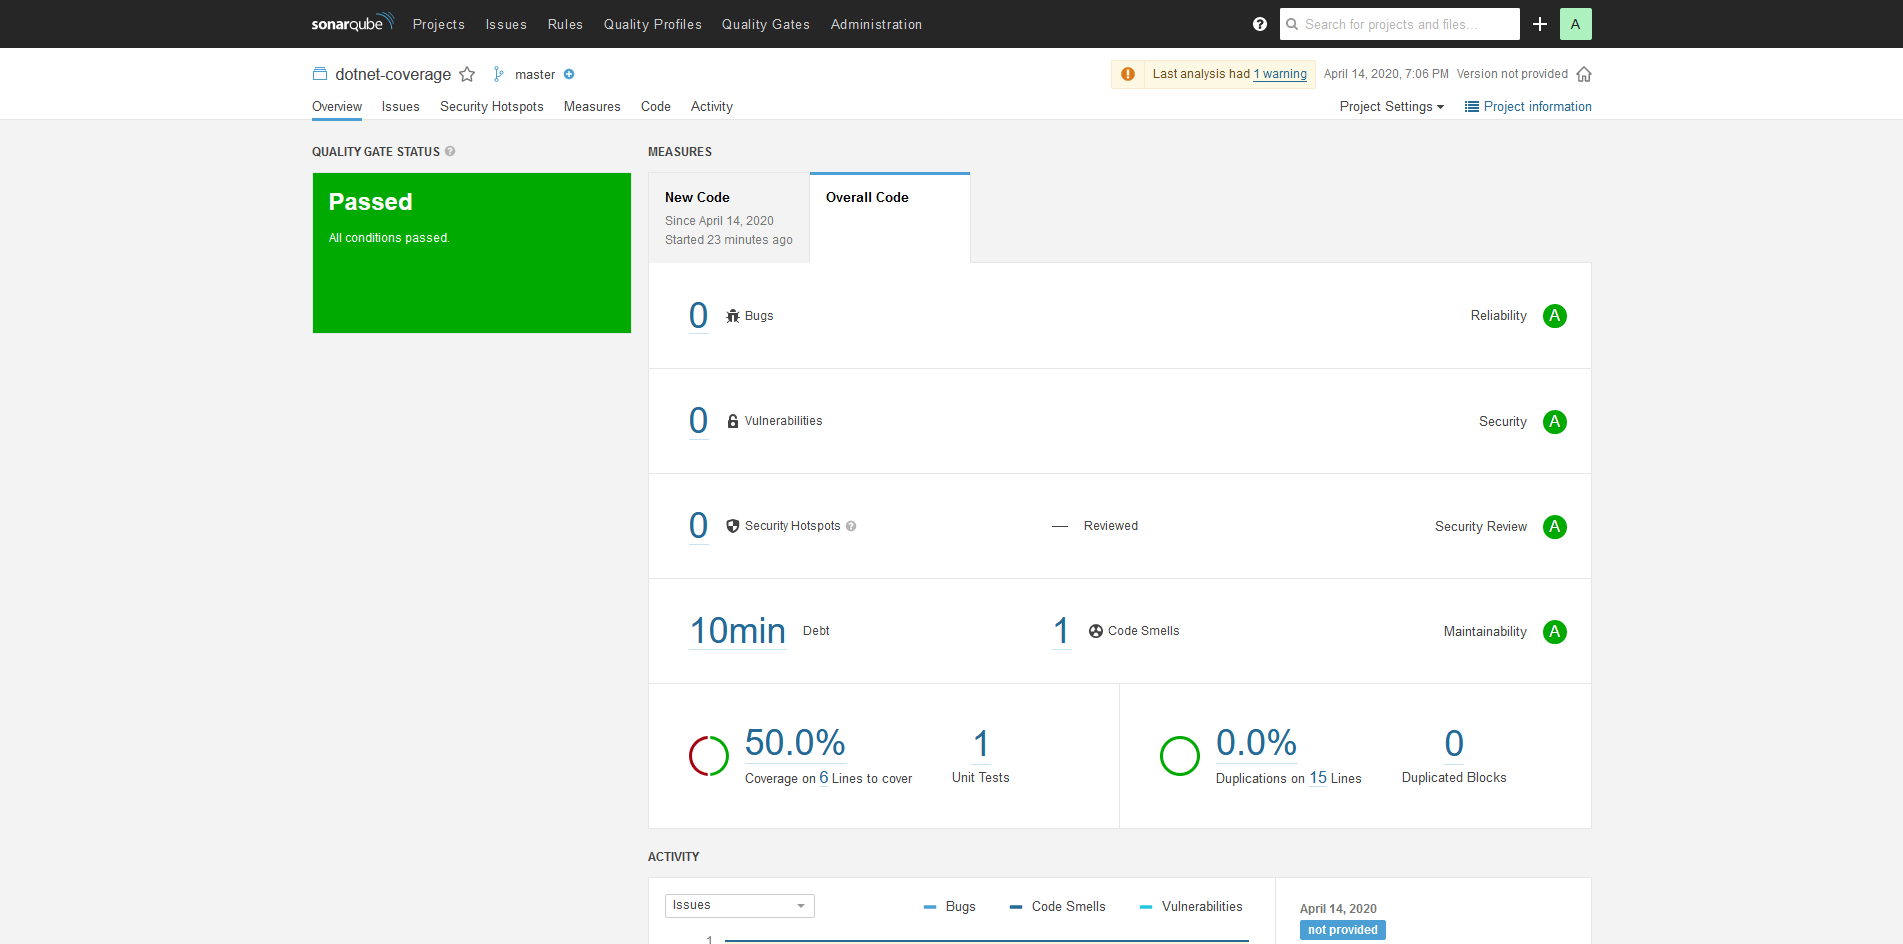
SonarQube project page reporting code coverage and number of tests.
We should see 1 unit test. If there are more, cleaning the Cover.Tests\TestResults and run the analysis again should fix it. SonarQube was counting the number of tests inside the file, so if there were multiple TRX files that matched the pattern, hence the number.
.NET SonarScanner settings
Hey, I tried but with no luck. Still didn’t know how or where to create that file. Created a XML inside the .sonarqube directory: was deleted after usage. Created a sonar-project.properties was unreadable by the scanner. Help me D:
Closing
Did you like it? It was useful? Leave a comment below! Bla bla bla, like and subscribe :)
It was useful? Done something similar? Have feedback?